Differences between AlignView and PhyloView
Users can switch between views through the "View" menu, and either selecting "switch to ..." or "Change root species". With the latter, users are presented with a 4-column table where one of the two views (columns 3 and 4) must be selected for a given root ancestor (column 1). See below for a quick graphical overview of the differences between the two type of views. Columns 3 and 4 (e.g. [34 desc.]) indicate the number of nodes in the tree that will be shown in the display in the corresponding view. In AlignView, this corresponds to the number of species (ancestral and extant) that descend from the ancestor shown in column 1. In PhyloView, this corresponds to all the nodes that descend from the ancestral copy of the reference gene in the ancestral root species shown in column 1, including speciation nodes (intermediate ancestral copies of the reference gene), duplication nodes, and terminal nodes (modern copies of the gene in extant species). In short, AlignView will be based on a species tree, while PhyloView will be based on a phylogenetic tree specific to the reference gene. The example below is a query for gene CD209 in human, with Primates as root.
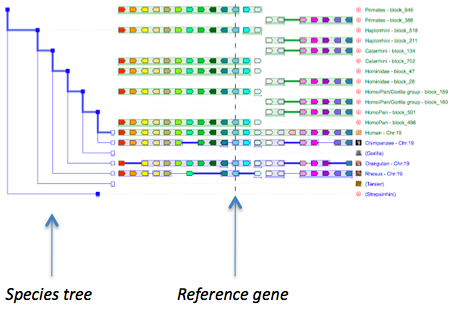
AlignView
This view shows an alignment between gene orders in different species. The species chosen intially when querying the database is the reference species, and the reference gene itself is positioned in the centre of the display, intersecting with the dashed line. The species tree is shown on the left of the aligned genomes, and by default 10 genes on either side of the reference gene will be shown in the reference species, with different colours. Orthologs of these genes in other species are shown in matching colours. If a species shares the root ancestor (here the primate ancestor) with the reference species but does not possess any ortholog of the 21 genes on display in the reference genome (the reference gene plus 10 genes on either side) then this species is not shown at all.
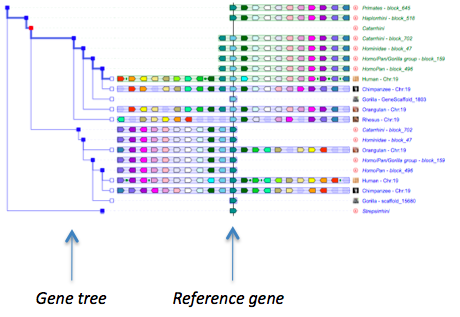
PhyloView
This view shows the gene order of a reference gene and its neighbouring genes, and the order of their respective orthologs and paralogs in different species that share the same ancestral "root" species. The tree on the left of the display is the phylogenetic tree (computed by Ensembl) of the gene shown in the middle that intersects the vertical line. In this view, some species may appear twice if there is a duplication node shown as square (as here in the second node along the red path). Orthologs of these genes in other species are shown in matching colours. See here for a more detailed legend of PhyloView symbols.
Symbol Legend

|
The gene initially placed in the centre of the display and aligned over a vertical black line is the gene that was used as query (reference gene). |

|
Genes outlined in white are paralogs of the genes in the same colour but outlined in black. |

|
PhyloView only: shaded genes correspond to genes that are not orthologous to any genes from the species used in the query (reference). |

|
Coloured genes over a light blue background corresponds to extant or ancestral genes that are i) orthologous to genes from the species used in the query that show the same colour ii) but belong to other branches than the branch leading from the ancestral root to the extant species used as queries. |

|
Coloured genes over a light green background corresponds to ancestral versions of the genes from the species used in the query that show the same colour. |

|
Branches shown as thicker lines in lighter blue represent the path leading from the ancestral root to the reference species used as query. |

|
Blue square nodes represent ancestral species leading from the same "root" ancestral species to orthologs and/or paralogs of the gene used as query. |

|
Red square nodes represent duplication events of an ancestral version of the gene used as query. |

|
Open blue square nodes represent extant species. |


|
In PhyloView, coloured circles between genes indicate intergenic Conserved Non-coding Elements (CNEs). The colour from green to red to blue indicates the level of conservation (respectively CNE set1, set2, set3; see the CNE section for more information). |


|
In PhyloView, coloured bars between genes indicate intronic Conserved Non-coding Elements (CNEs). The "host" gene is always the first gene on the left of the CNE. The colour from green to red to blue indicates the level of conservation (respectively CNE set1, set2, set3; see the CNE section for more information). |
|
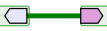
In AlignView, a thick green line between two genes in an ancestral species is equivalent to a "gap" in the alignment, i.e. the two genes are neighbours in this species but not in the reference species, where the two orthologs are separated by one or more genes. |
|
|
In AlignView, a thick blue line between two genes is equivalent to a "gap" in the alignment of this extant species, i.e. the two genes are neighbours in this species but not in the reference species, where their orthologs are separated by one or more genes. Clicking on the line brings up a window indicating the size of the gap in base pairs, and a link back to other genome browsers. |

|
In AlignView, a thin green line between two genes is equivalent to a "break" in the continuity of the alignment, i.e. the two genes are linked (on the same chromosome or scaffold) in the order shown in the corresponding extant species but at least one gene separates the two genes in that species |
|
|
In AlignView, a thin double-headed arrow under a block of genes means that the order of the genes shown was flipped around (reversed) compared to the "canonical" orientation found in e.g. Ensembl for extant species and in this browser for ancestral species. |